Linux servers are often praised for their performance and efficiency. But even a well-configured system can suddenly feel slow or unresponsive. It can have plenty of CPU and memory available yet still feel painfully slow. In many cases, the real culprit is disk activity. When a process starts reading or writing heavily to disk, it can slow down everything else on the system. Knowing how to quickly find what process is using the most disk I/O in Linux can save hours of troubleshooting.
Instead of guessing what might be happening, Linux provides several built-in tools that make it easier to spot disk-intensive processes in seconds. Once you identify the source of the problem, you can take the right steps to control it before it affects other services.
Let’s walk through a few practical ways to track down disk activity and determine what process is causing the slowdown.
Disk I/O Bottlenecks Explained
Before jumping into commands, it helps to understand why disk activity can impact performance so heavily.
Most systems rely on three main resources:
- CPU – Handles processing tasks
- RAM – Stores data that programs need quick access to
- Disk Storage – Handles reading and writing files
A CPU bottleneck happens when the processor cannot keep up with tasks. A memory bottleneck occurs when the system runs out of RAM and starts swapping.
Disk bottlenecks are different. Storage devices are usually much slower than RAM. When a process performs large or constant read and write operations, the disk queue grows. Other programs must wait for access, which creates system-wide slowdowns.
Some common symptoms of disk-heavy processes include:
- Slow application response times
- High disk wait time (often seen as high I/O wait in system monitors)
- Delayed file operations
- Databases or web applications responding slowly despite low CPU usage
When these symptoms appear, the next step is to find which process is using the most disk I/O.
Check Disk Activity with iotop
One of the easiest ways to monitor disk activity is with the iotop utility. It works similarly to top, but focuses on disk usage instead of CPU.
Installing iotop
On many distributions, iotop may not be installed by default. You can install it using your package manager.
Ubuntu / Debian
sudo apt install iotopCentOS / RHEL / AlmaLinux
sudo dnf install iotopRunning iotop
iotop requires root privileges to display accurate information.
sudo iotopOnce running, it displays a live view of processes performing disk reads and writes.
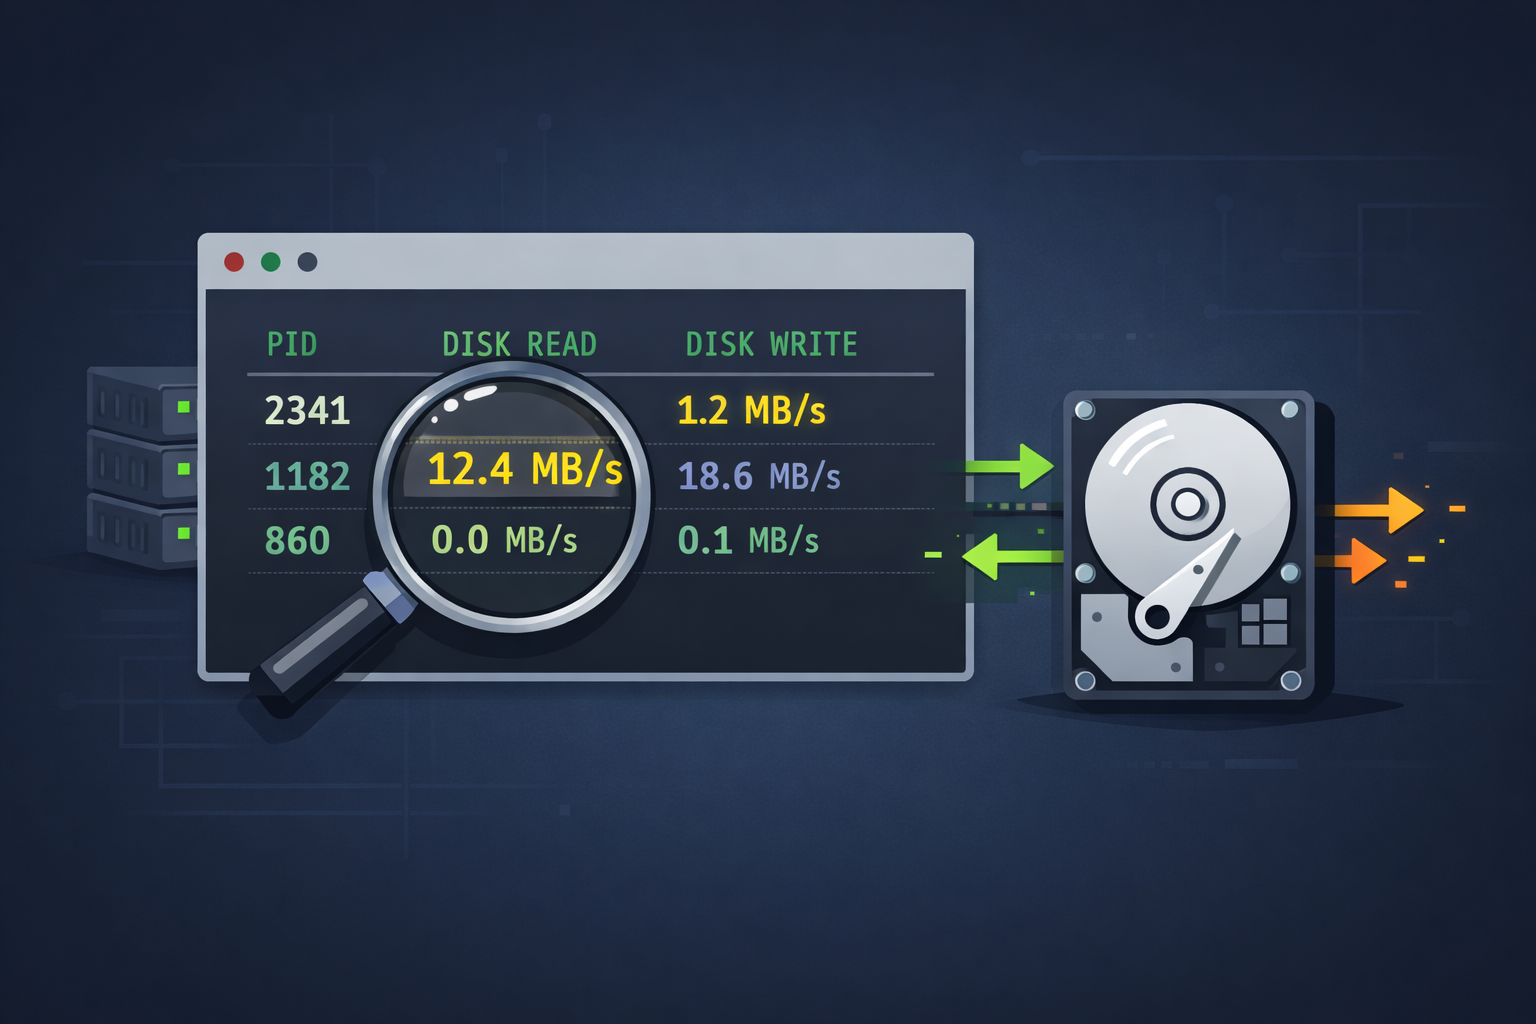
Understanding the Output
You will see columns such as:
- PID – Process ID
- USER – User running the process
- DISK READ – Data being read from disk
- DISK WRITE – Data being written to disk
- COMMAND – The process or program name
Processes with the highest read or write values are typically the ones consuming the most disk resources.
A helpful option is:
sudo iotop –oThis displays only processes actively using disk I/O, making it much easier to identify what process is using the most disk I/O at that moment.
Using pidstat to Monitor Disk Usage
Another useful tool is pidstat, which is part of the sysstat package. It provides detailed statistics about process activity, including disk operations.
Running pidstat for Disk Monitoring
pidstat -d 2This command reports disk I/O statistics every two seconds.
The output includes:
- kB_rd/s – Kilobytes read per second
- kB_wr/s – Kilobytes written per second
- Command – The process responsible for the activity
This tool is useful when you want to monitor activity over time instead of just a quick snapshot.
You can also monitor a specific process if you already know its PID:
pidstat -d -p 1234 2This allows continuous tracking of disk usage for that particular program.
Identifying which Files are Being Accessed
After discovering which process is generating heavy disk activity, the next step is understanding what files it is accessing.
This is where the lsof command becomes useful.
Using lsof
lsof stands for “list open files.” It shows which files a process currently has open.
For example:
sudo lsof -p 1234Replace 1234 with the process ID you discovered earlier.
This command reveals:
- Log files being written continuously
- Large data files being read
- Temporary files being generated
Checking open file handles can quickly reveal the root cause of the disk activity.
For instance, a process might be writing endlessly to a log file or repeatedly scanning a large directory.
Investigating the Root Cause
Once you identify what process is using the most disk I/O, the next step is determining why.
Several common scenarios tend to cause disk spikes.
Backup Processes
Automated backups often read large amounts of data from disk. If backups run during peak usage hours, they can cause noticeable slowdowns.
Checking your backup schedule may reveal the reason behind the disk activity.
Database Activity
Databases frequently perform heavy read and write operations. Large queries, indexing tasks, or replication processes can generate significant disk usage.
If a database is responsible, reviewing recent queries or maintenance tasks can help pinpoint the issue.
Runaway Scripts
Occasionally a misconfigured script or application loop writes data repeatedly. Log rotation problems or poorly optimized scripts are common culprits.
Stopping or fixing the script usually resolves the problem quickly.
Preventing Disk I/O Problems
After resolving the immediate issue, it is worth taking a few preventive steps to avoid future disk bottleneck
Monitoring Tools
Continuous monitoring helps detect problems early. Tools such as:
iotoppidstatiostat- System monitoring dashboards
can alert you when disk activity spikes.
Resource Limits
Linux allows administrators to limit system resources for certain users or processes. Using tools like nice, ionice, or control groups can prevent a single program from monopolizing disk access.
Scheduled Maintenance
Tasks like backups, indexing, and log cleanup should run during off-peak hours whenever possible. This helps reduce the chance of heavy disk activity affecting active users.
Conclusion
Disk activity can quietly become one of the biggest performance bottlenecks on a Linux system. When applications start slowing down despite low CPU and memory usage, storage activity is often the real issue.
Using tools like iotop, pidstat, and lsof, you can quickly identify what process is using the most disk I/O and investigate what files or operations are responsible. With just a few commands, administrators can pinpoint problems that might otherwise take hours to diagnose.
Quick diagnostics can prevent disk activity from bringing your server to a halt. The faster you identify which process is using the most disk I/O, the faster you can restore normal performance and keep your Linux system running smoothly.